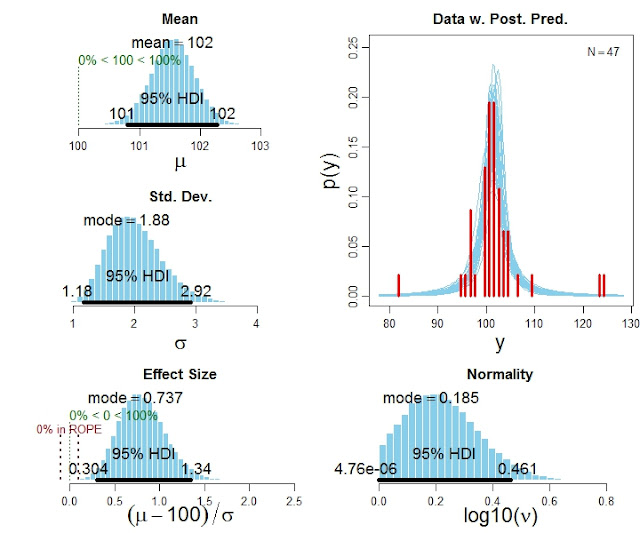
The in-press article, Bayesian estimation supersedes the t test, focuses on the two-group case. Various readers have wanted a one-group version, which is now available. It is in the zip file with the two-group programs.
Here is an example of the code for using the program:
# Specify the data
y = c(101,100,102,104,102,97,105,105,98,101,100,123,105,103,100,95,102,106,
109,102,82,102,100,102,102,101,102,102,103,103,97,97,103,101,97,104,
96,103,124,101,101,100,101,101,104,100,101)
# Run the Bayesian analysis:
source("BEST1G.R")
mcmcChain = BEST1Gmcmc( y )
# Display the results:
BEST1Gplot( y , mcmcChain , compValm=100 , ROPEeff=c(-0.1,0.1) , pairsPlot=TRUE )
The function BEST1Gplot returns detailed numerical summaries of the posterior distribution (not shown here), and it also produces graphical output like this:


Thank you very much for your paper, code and explanations!
ReplyDeleteDo you have pointers on how to expand your models for the case of weighted data - when we know the variance of each data point?
Dear John,
ReplyDeleteI like your paper very much and found your BUGS implementation quite compelling. The only thing I did not quite understand was how to deal with the situation where the HDI of the effect size partly overlaps with the ROPE, like in the fist example (IQ test) you present in the paper. There, the ROPE ranges from -.1 to .1 and the HDI ranges from 0.07 to 1.2. It seems that if the HDI overlaps with the ROPE, you would NOT accept H1 (because the Effect size is not credibly different from the ROPE). But from my reading of your paper, you argued in favor of H1 in this example.
The cases where the ROPE includes the HDI and where the two regions do not overlap have quite a clear interpretation, it's the case where they partly overlap that I'm struggling with.
Another question I had is if you can say anything beyond mere acceptance or rejection of the hypothesis based on the posterior distributions and the ROPE. For example, is it possible to quantify the evidence in favor of the competing hyptheses depending on how far away the HDI is from the ROPE, similar to a Bayes Factor?
Cheers,
Benjamin
ReplyDeleteBenjamin:
Thanks for your comment.
When the HDI and ROPE overlap, then no decision can be made (for that particular choice of HDI and ROPE).
In the early part of the article, before introducing the ROPE, the decision rule was to reject a value if it fell outside the HDI. This is tantamount to using a ROPE of zero width. But it also means that the null can never be accepted.
Some statisticians use a decision rule involving three zones: Less than the ROPE, within the ROPE, and greater than the ROPE. Then if the HDI overlaps only one edge of the ROPE, not both edges, then at least one of the three zones can be rejected (i.e., the zone that is entirely outside the HDI).
When the ROPE is narrow, the Bayes factor can be approximated by the proportion of the prior distribution within the ROPE relative to the proportion of the posterior within the ROPE. But see Appendix D of the JEP:General article for reasons to be cautious about the Bayes factor.
--John
ReplyDeleteDear Florian of Sept 12:
Thank you for your nice comment and message. Sorry I didn't reply sooner, but essentially I don't have an answer to your question yet. If you discover some good sources, please let us know. Thanks again.
--John
Hi John, thanks a lot for these clarifications! They were very helpful for me. Cheers, Benjamin
ReplyDelete